"A WELL-KNOWN management maxim warns, if you can’t measure it, you can’t improve it. By that reckoning, those trying to better the state’s criminal justice system are often flying blind.
How long, for example, does the average probationer in Massachusetts stay on probation? Or how many people last year had their probation revoked?
State Probation Commissioner Edward Dolan has no idea. While each probationer has their own physical case file, the Massachusetts Probation Department has no computer-based case management system that would let state officials or researchers track information on an aggregate basis.
“A lot of things we do, we do manually,” Dolan said."
Providing accurate and timely information about what matters in Franklin, MA since 2007. * Working in collaboration with Franklin TV and Radio (wfpr.fm) since October 2019 *
Tuesday, January 26, 2021
CommonWealth Magazine: "State slow to improve criminal justice data collection"
Monday, January 25, 2021
New DLS Data Visualization Tool Now Available: Municipal Finance Snapshot
Saturday, November 28, 2020
"Number of high-risk communities rises to 81"
From CommonWealth Magazine we share an article of interest for Franklin:
"THE NUMBER of communities considered high-risk for COVID-19 rose from 62 to 81 on Friday, as cases statewide continued to grow rapidly while deaths from the coronavirus grew more slowly.
The numbers followed what has become a predictable pattern during the second surge. Four weeks ago the Baker administration revised the metrics it uses to determine a high-risk, or red, community, causing the number to fall from 121 to 16. But since then the number of red communities has grown rapidly week by week, rising from 16 to 31 to 62 to 81.
Between November 8 and November 21, there were 36,194 new cases of COVID-19. More than half – 55 percent – of those infected were less than 39 years old, while those 70-plus accounted for just 7.6 percent of the cases. Deaths followed the opposite pattern: 83 percent of deaths were among those 70 or older and only 1.4 percent were 39 or less.
Deaths have been growing far more moderately than infections during this second surge. From November 8 to November 21, there were 357 deaths, up from 319 between November 1 and November 14. The deaths in the previous two-week intervals totaled 280 and 241. The Baker administration’s dashboard for Friday, which covered Wednesday afternoon through Friday morning, reported 4,464 new cases and 29 deaths."
 |
| Franklin Community data as of 11/25/20 |
Friday, August 14, 2020
"Data indicate spread of COVID-19 accelerating" in MA
From CommonWealth Magazine we share an article of interest for Franklin:
"THE SPREAD OF COVID-19 in Massachusetts appears to be accelerating, with the number of communities considered moderate or high-risk jumping by 40 percent and the state as a whole moving into the moderate risk category.
Gov. Charlie Baker released a breakdown by municipality on Tuesday that indicated four of the state’s 351 cities and towns were high risk and 29 were moderate risk. That information was based on the two-week period ending August 5.
On Wednesday evening, the Department of Public Health issued new municipal data based on the two-week period ending August 8. That new breakdown indicates the number of communities at high-risk had jumped from 4 to 11 and the number of communities considered moderate risk increased from 29 to 35. The state as a whole jumped from low risk to moderate risk.
The rankings are important as a barometer for COVID-19 in Massachusetts, but they have also taken on additional importance this week because the Baker administration is urging communities in the low-risk categories to send their children to school for in-person learning this fall. Communities are trying to decide between in-person and remote learning, or some hybrid combination of the two, by this Friday. The fast-changing information is making those decisions even more difficult."
Continue reading the article online (subscription may be required) https://commonwealthmagazine.org/health/data-indicate-spread-of-covid-19-accelerating/?
 |
| "Data indicate spread of COVID-19 accelerating" in MA |
Saturday, June 13, 2020
Chief Lynch's response to inquires about the 8cantwait.org campaign.
Massachusetts law enforcement agencies have long been in front of the curve when it comes to the advancement of police procedures designed to protect the health, safety and welfare of the citizens we protect.
In particular, our Massachusetts Police Officers have thoroughly embraced the six pillars of the principles embodied in the final report of the President's Task Force on 21st Century Policing, and remain committed to professional conduct, democratic policing and procedural justice for all people.
In response to the Final Report of the President's Task Force on 21st Century Policing (https://cops.usdoj.gov/pdf/taskforce/taskforce_finalreport.pdf), the Massachusetts Chiefs of Police Association (MCOPA) and the Massachusetts Major City Chiefs (https://www.franklinma.gov/police-department/files/massachusetts-chiefs-police-response-final-report-presidents-task-force-21st) drafted a response in September of 2015, addressing each of the pillars therein.
With respect to the 8 policies that departments should adopt, below is how each is addressed in Massachusetts and here at the Franklin Police Department:
- Ban chokeholds & strangleholds - These techniques are not part of the defensive tactics curriculum as instructed by the MPTC.
- Require de-escalation - Officers are required to learn de-escalation during the MPTC recruit academy training program, and further, are required to undergo additional de-escalation training during the annual in-service training programs as required by the MPTC.
- Require warning before shooting - Consistent with the standards set forth in Graham v. Connor and Tennessee v. Garner, officers may only use that level of force that is objectively reasonable based upon the totality of circumstances. Officers will always attempt to use the lowest level of force in order to effectuate the lawful objective and will attempt to warn individuals prior to using any level of force, provided that they have the time and opportunity to do so. There may be, however, some very limited instances, where it is impossible for officers to provide a warning prior to using force, such as when doing so is necessary in order to preserve human life.
- Requires exhaust all alternatives before shooting - Same as above.
- Duty to intervene - All officers are trained and required to intervene when they recognize that any other officer or supervisor, of any rank, is acting contrary to the law or policy. The MCOPA has recommended departments consider including the following language in their Use of Force policy and the Franklin Police Department is considering making this change: All officers of the Police Department should be aware of their personal responsibility during a use of force encounter. Officers shall have an affirmative duty to intervene should they observe a situation in which they perceive more than the necessary use of force is being deployed by a fellow officer.
- Ban shooting at moving vehicles - Officers are not permitted to shoot at a moving vehicle, except in the very limited circumstance where, consistent with the standard set forth in Graham v. Connor and Tennessee v. Garner, doing so is required to defend themselves or another when the occupants of the vehicle are employing deadly force, which the officer reasonably perceives as an immediate threat of death or serious physical injury to themselves or another (including situations where the vehicle itself is being used as a deadly weapon and the officer is unable to escape the path of travel), and the officer reasonably believes that they will not endanger innocent persons. It is imperative that officers not position themselves in such a way as to create a likelihood of being struck by an occupied vehicle.
- Require use of force continuum - Officers are all trained to use only that level of force objectively reasonable based upon the totality of the circumstances.
- Require comprehensive reporting - Offices are required to complete a use of force report for each instance where force is used.
For further information pertaining to this subject, please see The Franklin Police Department Use of Force Policy, Use of Force Data and the presentation by Chief Lynch to the Franklin Town Council on June 3, 2020, all located on the departments website at: https://www.franklinma.gov/police-department/pages/use-force-data
 |
| Chief Lynch's response to inquires about the 8cantwait.org campaign |
Tuesday, April 21, 2020
COVID-19 data visualizations
Data visualizations for COVID-19
https://informationisbeautiful.net/visualizations/covid-19-coronavirus-infographic-datapack/
 |
| Data visualizations for COVID-19 |
John Hopkins Interactive map (selected for MA and Norfolk County)
https://coronavirus.jhu.edu/us-map
 |
| John Hopkins Interactive map (selected for MA and Norfolk County) |
Monday, January 27, 2020
FTC Data Shows that the FTC Received Nearly 1.7 Million Fraud Reports, and FTC Lawsuits Returned $232 Million to Consumers in 2019
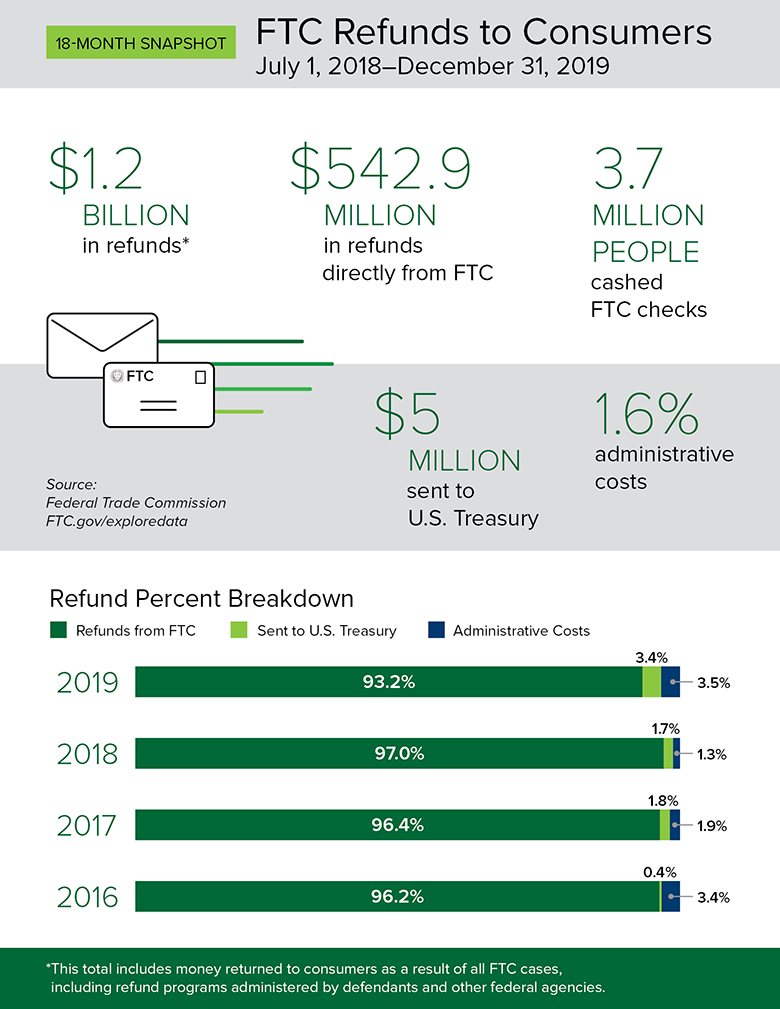
New data released by the Federal Trade Commission shows that FTC actions led to more than $232 million in refunds to consumers across the country in 2019.
A core part of the FTC's mission is to return money to consumers who are harmed by illegal business practices. Over the last four years, consumers have cashed more than $1 billion in FTC refund checks.
 |
| Refunds to Consumers |
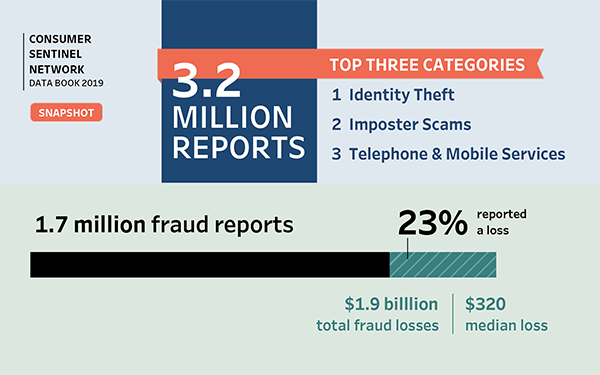
The most common type of fraud reported to the FTC in 2019 was imposter scams; government imposter scams, in particular, were the most frequently reported, and up more than 50 percent since 2018. Of all reports received, the top categories were identity theft, imposter scams, telephone and mobile services, online shopping, and credit bureaus.
Refunds to Consumers
Consumer Sentinel Infographic: there were 3.2 million reports in 2019 in which consumers reported losing more than $1.9 billion to fraud.The FTC Act allows the FTC to seek refunds from companies whose actions harm consumers.
 |
| Consumer Sentinel Network |
For the first time, data about the FTC's refund program will be available online in an interactive dashboard, including state-by-state and case-by-case breakdowns of the amount refunded to consumers. The dashboard is available at ftc.gov/exploredata.
The FTC's Consumer Sentinel Network is a database that receives reports directly from consumers, as well as from federal, state, and local law enforcement agencies and a number of private partners. The network received 3.2 million reports in 2019, including nearly 1.7 million fraud reports as well as identity theft and other reports.
Consumers reported losing more than $1.9 billion to fraud in 2019, with nearly $667 million lost to imposter scams alone. While scammers target consumers using every possible method of communication, phone calls were the most common. A small percentage of consumers who reported they encountered a fraud over the phone said they actually lost money. When they did, the median individual loss was more than $1,000.
The FTC uses the reports it receives through the Sentinel network as the starting point for most of its law enforcement investigations, and the agency also shares these reports with more than 2,500 law enforcement users around the country. While the FTC does not respond to individual complaints, Sentinel reports are a vital part of the agency's law enforcement mission.
Refunds to Consumers
https://www.ftc.gov/enforcement/cases-proceedings/refunds/data-refunds-consumers
FTC Data to Explore
https://www.ftc.gov/reports/consumer-sentinel-network-data-book-2019
Friday, January 24, 2020
FTC Consumer Alerts: The top frauds of 2019
|
https://www.ftc.gov/enforcement/data-visualizations/explore-data
 |
| Explore the FTC’s Consumer Sentinel Network data |
Wednesday, December 11, 2019
Is My 2020 Census Data Safe?
| It is our legal duty to protect your information. Learn more from our new Public Service Announcements. |
|
| Video Link -> https://youtu.be/qzmB5oJQ_z4 |
Thursday, November 14, 2019
Post-Secondary Employment Outcomes (PSEO) Explorer
"The U.S. Census Bureau released an update to Post-Secondary Employment Outcomes (PSEO) Explorer, a data visualization tool providing easy access to employment and earnings outcomes for college graduates based on the industries they enter after receiving their degrees. The PSEO pilot research program is being conducted in cooperation with higher education institutional systems to examine labor market outcomes of post-secondary graduates.
PSEO Explorer now features employment flows tabulations, which explore flows from institutions and degrees to the industries and geographies where graduates are employed. Tabulations on earnings outcomes compare data for different degree types by institution and years postgrad using grouped bar charts. Statistics will be updated for future graduation cohorts as they become available.
The Census Bureau is working to add higher education institution systems to the database."
 |
| For Univ Wisconsin-Madison, these five degree majors are shown |
You can find the tool at https://lehd.ces.census.gov/
A helpful video tutorial can be viewed on YouTube
https://youtu.be/bMThWNyhbe4
Saturday, July 27, 2019
Equifax Data Breach Settlement: How to Claim Your Benefits
|
 |
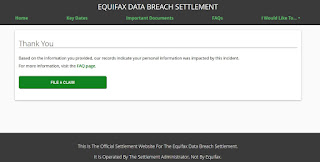
| confirm that you were part of the Equifax breech via this link ftc.gov/equifax |
 |
| https://www.equifaxbreachsettlement.com/file-a-claim |
Monday, July 22, 2019
"how much hydrocodone and oxycodone went to individual states and counties"
"For the first time, a database maintained by the Drug Enforcement Administration that tracks the path of every single pain pill sold in the United States — by manufacturers and distributors to pharmacies in every town and city — has been made public.
The Washington Post sifted through nearly 380 million transactions from 2006 through 2012 that are detailed in the DEA’s database and analyzed shipments of oxycodone and hydrocodone pills, which account for three-quarters of the total opioid pill shipments to pharmacies. The Post is making this data available at the county and state levels in order to help the public understand the impact of years of prescription pill shipments on their communities."
Continue reading the article online (subscription may be required)
https://www.washingtonpost.com/graphics/2019/investigations/dea-pain-pill-database/?utm_term=.d5e6c395d5bd
Check out the interactive database for numbers state and county
https://www.washingtonpost.com/graphics/2019/investigations/dea-pain-pill-database/?utm_term=.d5e6c395d5bd
 |
| https://www.washingtonpost.com/graphics/2019/investigations/dea-pain-pill-database/?utm_term=.d5e6c395d5bd |
Wednesday, December 5, 2018
Consumer Alerts: The Marriott data breach
|
Monday, August 27, 2018
“It’s not surprising that we would get this recognition again”
"For years, Franklin has made it onto the list of safest cities in the Unites States. This year, according to SafeWise, it is ranked the 52nd-safest city in the country.
Population-wise, said police Sgt. Brian Johnson, Franklin is one of the biggest cities on the list, despite its relatively town-like atmosphere.
The ranking is based on the most recent FBI crime report (https://ucr.fbi.gov/crime-in-the-u.s/2016/crime-in-the-u.s.-2016)."
Continue reading the article online (subscription may be required)
http://www.milforddailynews.com/news/20180826/franklin-makes-list-as-one-of-safest-us-cities
Go direct to the FBI study data
https://ucr.fbi.gov/crime-in-the-u.s/2016/crime-in-the-u.s.-2016/cius-2016
"Safewise is an independent review site. We may earn money when you click on links on our site" https://www.safewise.com/safest-cities-america
 |
| “It’s not surprising that we would get this recognition again” |
Thursday, May 24, 2018
US Census Bureau: Which Jobs Have the Largest Gender Pay Gap?
| Women continue to earn less than men in nearly all occupations, but the largest pay gap is... |
|
There are many more ways you can stay connected with us!
Join the conversation on social media
|
Thursday, May 17, 2018
US Census Bureau: Where Are Our Teachers Going?
| Teachers are leaving their jobs for other careers at a rate that has grown steadily every year in the past three years. |
|
| This is an official email from the U.S. Census Bureau. If you have any questions or comments, please contact us (http://www.census.gov/about/contact-us.html). |


