Showing posts with label data. Show all posts

Monday, October 30, 2023

Wonderful World of Wine (WWW) Episode 249: David Morrison The Wine Gourd Blog Interview (audio)

The Wonderful World of Wine (WWW) Episode 249

Welcome to another exciting episode of "The Wonderful World of Wine (WWW)”podcast! In this week's episode, Kim and Mark have a very special guest joining them - David Morrison, the acclaimed author of the Wine Gourd blog.

David is a data expert in the world of wine and has been passionately writing about it for years, garnering a large following of wine enthusiasts around the globe. With his extensive knowledge and unique perspective, David has become a trusted authority in the wine data industry.

During this interview, we delve into David's journey in the wine world and explore his blog, which covers a wide range of fascinating topics. From the latest wine trends to in-depth analysis of different wine regions and grape varieties, his blog offers a wealth of information for both seasoned wine connoisseurs and newcomers alike.

David shares his insights on various wine subjects.  

Join us as we uncover the stories behind David's most compelling blog posts and gain valuable knowledge from his vast experience in the industry. Whether you're a wine enthusiast, a sommelier, or simply curious about the world of wine, this episode is a must-listen!

So grab your favorite glass of wine, sit back, and tune in to another captivating edition of "The Wonderful World of Wine (WWW)" podcast, as we go behind the scenes with David Morrison, the renowned author of the Wine Gourd blog -> 

Cheers
Kim And Mark

Audio link -> 


Wednesday, July 12, 2023

State Facts for Students: MA summary via Census.gov

School is out for the summer but learning is really life long. Exploring the data available from Census.gov is worth spending sometime on. 

An email from them arrived in my Inbox and as it touted ice cream caught my eye. 
"What’s your favorite flavor(s) of ice cream? Did you know there were 427 U.S. ice cream and frozen dessert makers in 2020, 23 more than a decade earlier (2010)? 
Students can explore this and other cool data like the total number of kids in the U.S. ages 8 to 14 and the total number of U.S. amusement parks. 
What better way to celebrate National Ice Cream Month than to enjoy a frozen treat while using our State Facts for Students data tool to discover oh-so-sweet stats!"
I did explore the State Facts for Students page to obtain the summary for MA. I would have to go deeper into the data to get the details on how many ice cream makers there are in MA. 


National Ice Cream Month

Sunday, February 12, 2023

"Housing choice is mismatched to need" & 15 minute city model

Two graphics to help inform our local zoning discussions

One
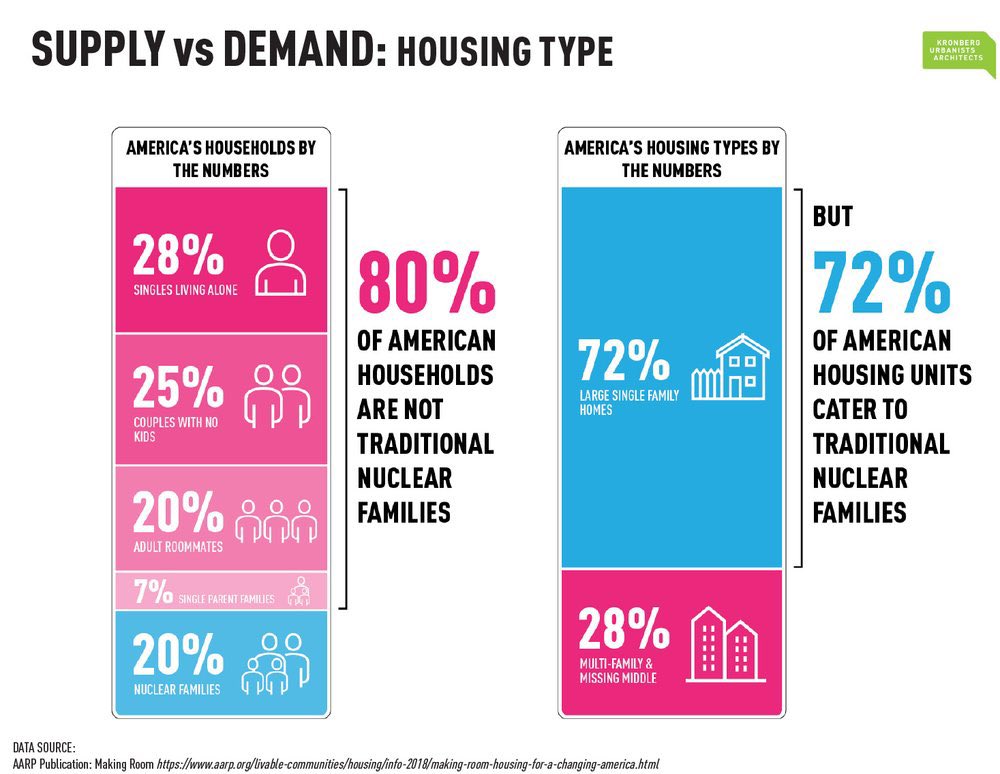
"Housing choice is mismatched to need."

Southern Urbanism "Housing choice is mismatched to need"

You can visit DataTown at the Mass Housing Project to get our local stats ->  https://mhpcenterforhousingdata.shinyapps.io/DataTown/#

Two
"The 15-minute city model is the idea that cities should be designed, or redesigned, so that within a 15-minute walk or bike of home, people should be provided the opportunity to access many of their daily needs like work, food, health, education, culture and leisure."
The 15-minute city model

Shared from Twitter -> https://twitter.com/berkie1/status/1624381496348794883

For more about the 15 minute city model -> https://www.15minutecity.com/


Sunday, July 31, 2022

"In a market badly out of kilter, many older residents are stuck in their homes" - Franklin an example

"They bought their homes when they were young, making money, and raising families. Now they’re empty nesters, in or nearing retirement, and living in houses that are too big for them.

But many older residents in Massachusetts who’d like to downsize — and turn over spacious dwellings to younger buyers desperate for room to expand —are finding it difficult, if not impossible. Even though their property values have ballooned, smaller homes or condos are scarce and carry prohibitive price tags in the state’s out-of-kilter real estate market.

“We’re just sitting tight right now,” said Mary Prosnitz, 66, of Wellesley. She and her 69-year-old husband, Jay, raised two sons, now grown, in the five-bedroom home they purchased 38 years ago and still live in."

Continue reading the Boston Globe article (subscriptions may be required)

From the Mass Housing Project Datatown, we find the data on the types of housing in Franklin compared to the Commonwealth of MA average.

The importance of housing diversity
A wide variety of housing types enables people of different means and at different stages of life to have viable housing options within a community. Different housing types allow for greater density in places where it is most appropriate, such as near transit and commercial, retail and business centers.

Looking at the adjacent comparison between the mix of housing types in your community and Massachusetts as a whole, do you think your community is achieving the kind of diversity that fosters a wide variety of choices? Does your mix of housing structure types foster inclusion or exclusion? Are you making the most of the land available for development?

While a wide variety of housing is required, Franklin is heavily single family home oriented

Wednesday, July 27, 2022

Franklin vs Worcester housing production by permit since 2000

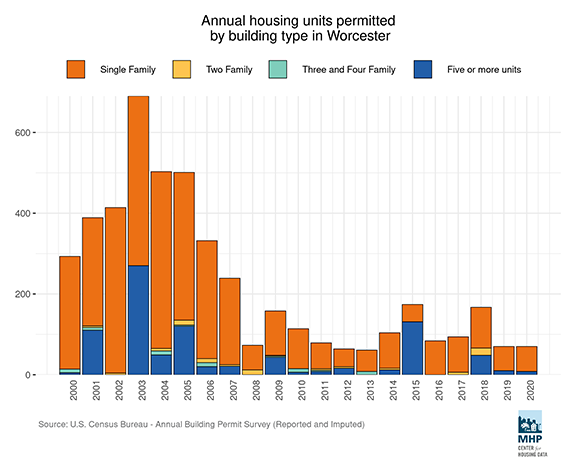
"Worcester is looking at inclusionary zoning to add affordable homes. This chart shows how slow housing development has been last +10 yrs, even as city's population grew.  
For more graphics like this, check out mhp.net/datatown"

Worcester data:

housing development has been last +10 yrs in Worcester, MA


What does Franklin's data look like? 

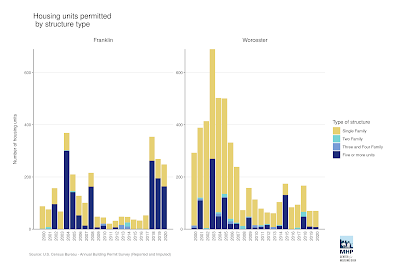
Note: please be careful with the visual comparison. The volume scale for Franklin (300-200-100) is significantly less than Worcester's (600-400-200).


The chart depicts how many new housing permits that Franklin has issued for each year of the data collection (net of demolitions), broken out by type of building

Check out more data from the Mass Housing Project's Datatown source

The Datatown query does allow for comparisons with communities so I did manage to put the Franklin and Worcester data together to see the info on the same scale:

Franklin and Worcester data together to see the info on the same scale

Sparked by the MHP tweet - https://twitter.com/mhpdata/status/1551662361110630401

Monday, July 4, 2022

Census Bureau Profile America Facts for Features: The Fourth of July - 2022


Registered United States Census Bureau Logo

The Fourth of July: 2022

Patriotic Places

JUNE 29, 2022

On July 4, 1776, the Continental Congress approved the Declaration of Independence, setting the 13 colonies on the road to freedom as a sovereign nation. As we celebrate this Independence Day, we reflect on how our Founding Fathers enshrined in our Constitution the importance of statistics as a vital tool for measuring America.

Most of the following facts are possible thanks to responses to U.S. Census Bureau censuses and surveys. We appreciate the public's cooperation as we continuously measure our people, places and economy. 

Did You Know?

2.5 million

The estimated number of people living in the newly independent nation in July 1776. Source: Historical Statistics of the United States: 1789-1945

331,449,281

The nation's population on April 1, 2020. Source: 2020 Census

56

The number of signers of the Declaration of Independence.

It is also worth noting that:

  • John Hancock, a merchant by trade, was the first signer. In 2020, more than 1 million business establishments nationally with paid employees were in the retail trade industry like Hancock. Source: 2020 County Business Patterns, Table CB2000CBP
  • Benjamin Franklin, who represented Pennsylvania, was the oldest signer of the Declaration of Independence at age 70. Pennsylvania had a resident population of 13,002,700 on April 1, 2020. Edward Rutledge of South Carolina was the youngest signer at age 26. South Carolina had a resident population of 5,118,425 on April 1, 2020.

Source: 2020 Census 

                                     Patriotic Places 

  • Places with the word "liberty" in their names.

Source: Vintage 2021 Population Estimates

  • Places with the word "union" in their names.

Source: Vintage 2021 Population Estimates 

                                      Related News Products 

Previous Facts for Features

Stats for Stories

Previous Graphics

###

Editor's note: The preceding data were collected from a variety of sources and may be subject to sampling variability and other sources of error. We typically release Facts for Features at least a month before an observance to accommodate magazine production timelines. Questions or comments? Contact the Census Bureau's Public Information Office at 301-763-3030 or pio@census.gov.

Learn More

Help us spread the word about Census Bureau data!

Share this on social media or forward it to a friend.

Share This

About the Census Bureau

We serve as the nation's leading provider of quality data about its people and economy. The Census Bureau is the federal government's largest statistical agency. As the world's premier statistical agency, we are dedicated to making our nation a better place. Policy-makers, businesses, and the public use our data to make informed decisions.

Resources for Media

For media interviews, please contact the Public Information Office Toll Free at 877-861-2010, 301-763-3030, or pio@census.gov


Thursday, April 7, 2022

Fertility Rates: Declined for Younger Women, Increased for Older Women (US Census data)

Demographics is a topic coming up from time to time in discussions around Franklin. What is our population? Why is our school population declining? The US Census stats show that our student population decline is not unique to Franklin.

Stable fertility rates 1990-2019 mask distinct variations by age. Learn more in this America Counts story.
Registered United States Census Bureau Logo

America Counts: Stories Behind the Numbers

A mother lays in a hospital bed with her newborn child.
Gray Divider

Fertility Rates: Declined for Younger Women, Increased for Older Women

Overall fertility trends from 1990 to 2019 were relatively stable, compared to previous decades but varied significantly by age, according to a Census Bureau analysis.

The analysis, which looked at Census Bureau and National Center for Health Statistics data, shows fertility rates of women ages 20-24 declined by 43%, while those of women ages 35-39 increased by 67% during the roughly 30-year period.

Read More

Together, the data paint a compelling picture of how the age at which American women give birth has changed over time.

Fertility rates in the United States gradually declined from 1990 to 2019. In 1990, there were about 70.77 births each year for every 1,000 women ages 15-44. By 2019, there were about 58.21 births per 1,000 women in that age group.

Continue reading to learn more about:

  • Fertility trends: 1990-2019
  • Shifting age structures
  • Early 2000s mini birth boom
  • Historical fertility patterns

Help us spread the word about America Counts. Share this story on social media or forward it to a friend.

Share This

You May Be Interested

A pregnant woman lays down on an examination table while hooked up to monitors.

U.S. Births Declined During the Pandemic: Several factors affect the birth rate but the pandemic did have an impact: births declined but began to rise again in March of this year.

Learn More

About America Counts

America Counts tells the stories behind the numbers in a new inviting way. It features stories on various topics such as families, housing, employment, business, education, economy, emergency management, health, populationincome and poverty. Contact our Public Information Office for media inquiries or interviews.

Don't miss an America Counts story! Subscribe here.


Friday, December 24, 2021

News Literacy Project --> a concise one-pager to better understand and avoid misinformation

"New from @NewsLitProject -- a concise one-pager with key insights, takeaways and reminders to help you and your loved ones better understand and avoid misinformation:

More about misinformation -> https://t.co/8UTBmli8NO
 
One pager ->  https://t.co/3FyPn4Wg4a"

News Literacy Project --> a concise one-pager  to better understand and avoid misinformation
News Literacy Project --> a concise one-pager  to better understand and avoid misinformation


Wednesday, December 1, 2021

"Whoever controls big data technologies will control the resources for development"

"The Most Powerful Data Broker in the World Is Winning the War Against the U.S."

"President Biden came away from his summit with China’s President Xi Jinping on Nov. 15 committed to prosecuting what he called “simple, straightforward competition” with China. Yet Beijing is already beating the United States and its allies in one crucial domain: data.

Data is the oil of the 21st century, the indispensable resource that will fuel artificial-intelligence algorithms, economic strength and national power. The wellspring of this data is all of us: our health records and genetic sequences, our online habits, the supply chain flows of our businesses, the terabytes of imagery guzzled by phones, drones and autonomous cars.

The competition for global influence in the 21st century will require protecting and harnessing this data to achieve commercial, technological and military advantages. So far, China is winning, and the West is barely even engaged."
Continue reading the article online (subscription maybe required)
https://www.nytimes.com/2021/11/30/opinion/xi-jinping-china-us-data-war.html

Illustration by Alvaro Dominguez; Photographs by Alessandra Benedetti - Corbis, MEHAU KULYK/SCIENCE PHOTO LIBRARY, and Peter Dazeley via Getty Images

Sunday, October 24, 2021

MA city/town COVID-19 daily new cases

This Flourish view of COVID-19 data for the CommonWealth of MA is interactive so you can select and compare one or more communities to the State or each other. I set up a comparison of Franklin to the State level shown in the photo capture shown here.

Thanks to Nathan Ahlgren for this tool.  https://app.flourish.studio/visualisation/4817758/?s=03

MA city/town COVID-19 daily new cases
MA city/town COVID-19 daily new cases 


Monday, October 4, 2021

60 Minutes "a betrayal of democracy" leads to decision that Franklin Matters Facebook page to go away Dec 1, 2021

60 Minutes (@60Minutes) tweeted at 7:42 PM on Sun, Oct 03, 2021:

"The version of Facebook that exists today is tearing our societies apart and causing ethnic violence around the world," says former Facebook employee France Haugen. She points to Myanmar, where the military used Facebook to launch a genocide.
Find the full 60 Minutes segment here -> https://t.co/WU4IumjHkO 

Shared from Twitter: https://t.co/cy9Ed9MgbH


Note: this is a continuation of the revelations about Facebook since the  Cambridge Analytica scandal. in 2018  I attempted to remove Franklin Matters updates from Facebook at that time and the readers, followers on Facebook created an uproar so I stayed reluctantly.

As a data security and privacy professional I can no longer condone the Facebook business model. Effective Dec 1, 2021 the Franklin Matters Facebook page will go away. You are given notice to find one of the other options to obtain the valuable information shared but not longer directly by me on Facebook.

Someone can also set up a way to take what I share and share it themselves to Facebook. I have no way to stop that. Folks occasionally do so on their own today.

My personal account will remain on Facebook to maintain my family and network connections. I have limited what is posted and shared in that way and am willing to take the risk to maintain those family connections.

I can no longer take the risk exposing your information in this way. Facebook needs to change and only actions like this will get their attention to do so.

Why Dec 1?
The Franklin election is important and as divisive as Facebook is, for those who depend upon it for info, I will provide some time for them to begin to make their move to one of the alternatives.

If you need or want help setting up email or RSS, I'll offer to schedule a Zoom session (or two) to walk through the process. Let me know if you are interested via email or comment on this post.


Reference points on Facebook data leaks
Mark Hurst's Good Report also has a listing on RSS Readers to add to what I shared here.  https://goodreports.com/post/rss-reader.html

Franklin Matters Facebook page to go away Dec 1, 2021