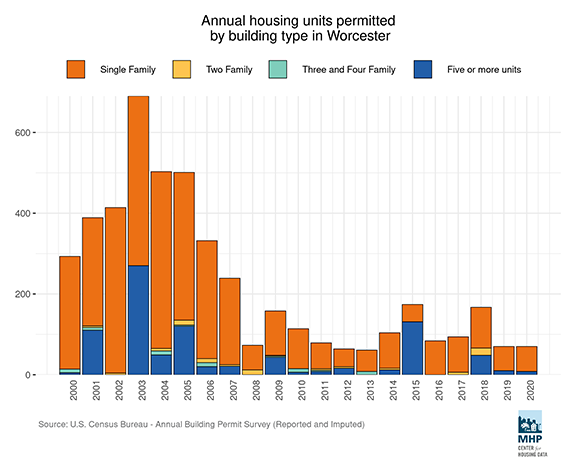
"Worcester is looking at inclusionary zoning to add affordable homes. This chart shows how slow housing development has been last +10 yrs, even as city's population grew.
For more graphics like this, check out mhp.net/datatown"
Worcester data:
 |
| housing development has been last +10 yrs in Worcester, MA |
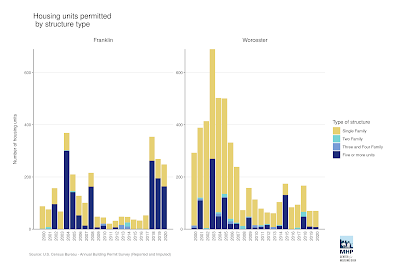
What does Franklin's data look like?
Note: please be careful with the visual comparison. The volume scale for Franklin (300-200-100) is significantly less than Worcester's (600-400-200).

The chart depicts how many new housing permits that Franklin has issued for each year of the data collection (net of demolitions), broken out by type of building
Check out more data from the Mass Housing Project's Datatown source
The Datatown query does allow for comparisons with communities so I did manage to put the Franklin and Worcester data together to see the info on the same scale:
 |
| Franklin and Worcester data together to see the info on the same scale |
Sparked by the MHP tweet - https://twitter.com/mhpdata/status/1551662361110630401