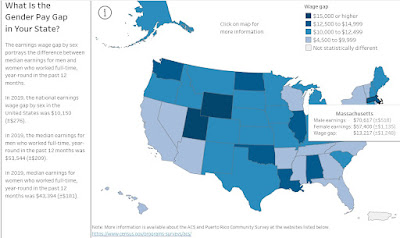
Women's History Month: March 2022 National Women's History Month traces its roots to March 8, 1857, when women from various New York City factories staged a protest over poor working conditions. The first Women's Day celebration in the United States was in 1909, also in New York City. More than seven decades later, Congress in 1981 established National Women's History Week to be commemorated annually the second week of March. In 1987, Congress expanded the week to a month and every year since has passed a resolution (and the president has issued a proclamation) designating March Women's History Month. As we celebrate Women's History Month 2022, we reflect upon advances women have made over the last decade. Women have increased their earnings, education and fields of occupation, and continue to have longer average life spans than men. Below are some Census Bureau stats highlighting these and other changes over the years. We appreciate the public's cooperation in helping us measure America's people, places and economy. Did You Know? 164.8 million The number of females of all ages in the United States. There were 159.9 million males of all ages. Source: 2019 American Community Survey, 5-Year Estimates 2 to 1 The approximate ratio of women to men ages 85 and older (4.1 million to 2.2 million) in the United States. Source: 2019 American Community Survey, 5-Year Estimates 20.7% In 2019, the percentage of women 25 and older with a bachelor's degree as their highest degree; 19.9% of men had a bachelor's degree as their highest degree. Source: 2019 American Community Survey, 5-Year Estimates 80.8% Women's median earnings as a percentage of men's median earnings, for full full-time, year-round workers 16 years and older. Source: 2019 American Community Survey 5-Year Estimates  What Is the Gender Wage Gap in Your State?  Written by: Megan Wisniewski The gender-based wage gap in the United States has narrowed in recent years, but disparities remain: national median earnings for civilians who worked full-time, year-round in the past 12 months was $53,544 for men compared to $43,394 for women, according to the U.S. Census Bureau's 2019 American Community Survey (ACS). There are a multitude of factors that may contribute to earnings differences between women and men: age, number of hours worked, presence of children, and education. The types of jobs women and men hold, and the earnings difference among these occupations also contribute to gaps in overall earnings. A new visualization tool depicts the gender-based wage gap at the state level using 2019 ACS and 2019 Puerto Rico Community Survey data. The wage gap data visualization highlights the top occupation and the three top occupations for men and women for each state by count of workers. Gender Pay Gap Visualization  | 
