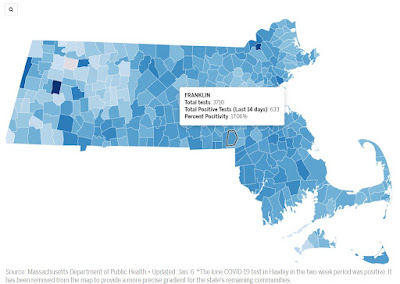
COVID-19 case counts continue to be driven by the omicron variant. Last week's positivity was 8%, this week we are at 17.06%. Yup, more than doubled.
Yes, the chart doesn't look the same as last week for a rather significant reason: The Y axis scale has changed due to the rise in cases exceeding the prior view. Last week's chart also show for comparison.
 |
| chart for week of 1/06/22 - note scale for Y axis vs for last week |
 |
| chart for week of 12/30/21 - note the Y axis scale is less than 80 |
Boston Globe community coverage
Mass.gov COVID-19 page -> https://www.mass.gov/info-details/covid-19-response-reporting
The CDC page for COVID-19 tracking -> https://covid.cdc.gov/covid-data-tracker/#datatracker-home
