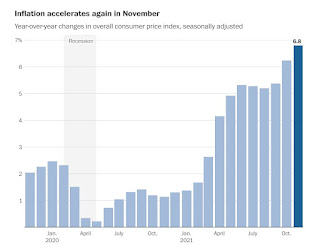
"The bumpy economic recovery has had policymakers, economists and American households grappling with greater price hikes for groceries, gas, cars, rent and just about everything else we need.The latest inflation data, released by the Bureau of Labor Statistics, showed prices in November rose to a nearly 40-year high, climbing 6.8 percent compared with the year before.For months, officials at the Federal Reserve and White House argued that pandemic-era inflation will be temporary. But they’ve had to back away from that message, which was increasingly hard to square with what was happening in the economy — and the way Americans experience it.Persistent supply chain backlogs and high consumer demand for goods have kept prices elevated. There is no clear answer for when that will change, leaving Americans to feel the strain in their pocketbooks in the meantime. This is a breakdown of how we got here."
Continue reading the article online (subscription maybe required)
 |
| Year-over-year changes in overall consumer price index, seasonally adjusted |